Pushboard + ClickHouse for serverless data analytics

ClickHouse is a powerful tool for data analytics, and with clickhouse-local[1], it's possible to set up a serverless environment for even greater flexibility. However, if you're looking to visualize your data using traditional dashboard or BI solutions with clickhouse-local, you may run into some challenges.
- Visualization tools like Tableau, Power BI use database connector and require a static endpoint(IP/Port) to connect to. However, clickhouse-local's serverless nature make it challenging to access due to dynamic IP address or complex configuration to expose the endpoint to public network.
- When it comes to plotting graphs using libraries like Matplotlib, Plotly, or D3.js, one potential obstacle is the amount of boilerplate code required to set up a basic visualization.
A potential workaround is to save the query results as a CSV, JSON or Parquet file, and load them into data visualization tools that support reading these file formats.
Today you will learn how to use a command like this:
~/clickhouse local \
-q "select toHour(tpep_pickup_datetime) x__hour, count(*) y1__num_trips
from file('yellow_tripdata_2022-11.parquet')
group by x__hour order by x__hour FORMAT JSON" |
curl \
  --request POST 'https://pushboard.io/api/carddata/<card_id>/' \
  --header 'Content-Type: application/json' \
  --data-binary @-
to plot a chart using Pushboard in conjunction with clickhouse-local
The sample dataset used in this tutorial is from New York Taxi Trip Trip Record data (opens in a new tab)
The particular parquet file can be downloaded at yellow_tripdata_2022-11.parquet (opens in a new tab)
How things work
clickhouse-local
clickhouse-local lets you execute queries from the command line against databases and files.
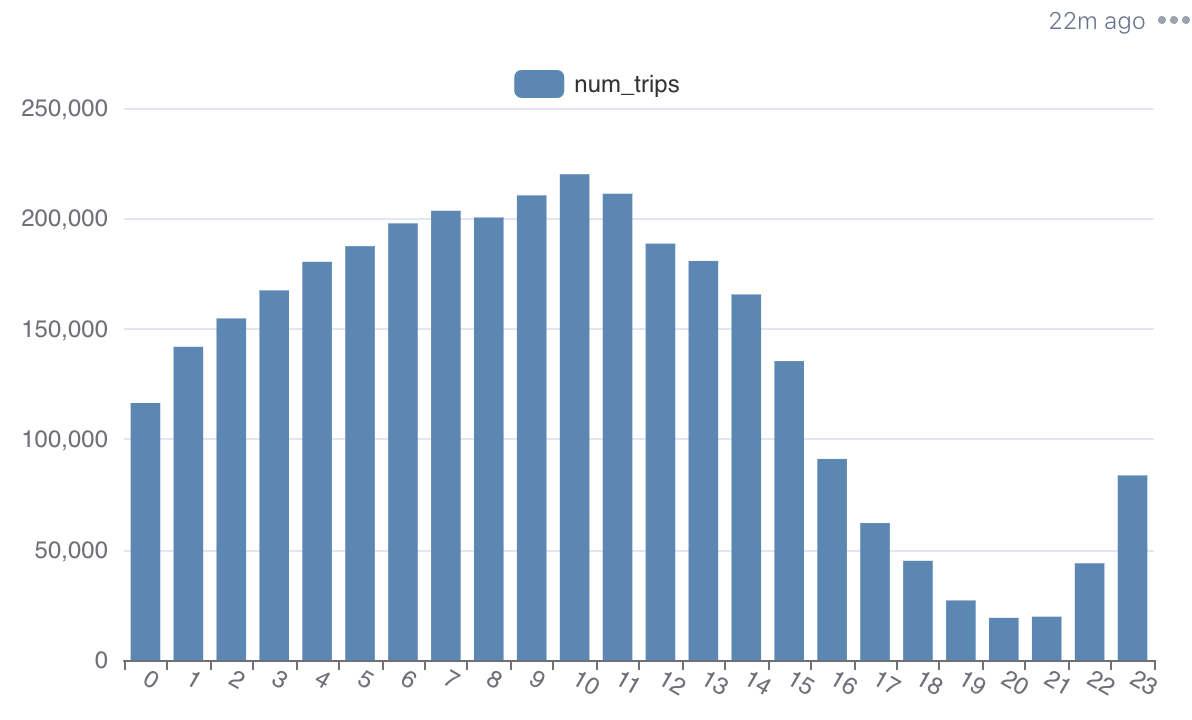
Here's the query for calculating the number of trips of New York Taxi per hour for November 2022:
~/clickhouse local \
-q "select toHour(tpep_pickup_datetime) x__hour,
count(*) y1__num_trips, bar(y1__num_trips, 0, 240000, 25) bar
from file('yellow_tripdata_2022-11.parquet')
group by x__hour order by x__hour format PrettyCompactMonoBlock"
We use bar() function and PrettyCompactMonoBlock to prettify and visualize the result:
┌─x__hour─┬─y1__num_trips─┬─bar─────────────────────┐
│       0 │        116392 │ ████████████            │
│       1 │        141833 │ ██████████████▊         │
│       2 │        154705 │ ████████████████        │
│       3 │        167401 │ █████████████████▍      │
│       4 │        180328 │ ██████████████████▊     │
│       5 │        187423 │ ███████████████████▌    │
│       6 │        197758 │ ████████████████████▌   │
│       7 │        203454 │ █████████████████████▏  │
│       8 │        200429 │ ████████████████████▉   │
│       9 │        210438 │ █████████████████████▉  │
│      10 │        220011 │ ██████████████████████▉ │
│      11 │        211176 │ █████████████████████▉  │
│      12 │        188577 │ ███████████████████▋    │
│      13 │        180730 │ ██████████████████▊     │
│      14 │        165560 │ █████████████████▏      │
│      15 │        135388 │ ██████████████          │
│      16 │         91062 │ █████████▍              │
│      17 │         62026 │ ██████▍                 │
│      18 │         44921 │ ████▋                   │
│      19 │         26982 │ ██▊                     │
│      20 │         19095 │ █▉                      │
│      21 │         19618 │ ██                      │
│      22 │         43810 │ ████▌                   │
│      23 │         83600 │ ████████▋               │
└─────────┴───────────────┴─────────────────────────┘
Pushboard
Once we have the query results, we can easily deliver the results to Pushboard to plot a graph.
First, we need to obtain a push endpoint from Pushboard:
-
If it's your first time using it, you can see a blank card. Click on the "Start Pushing" button and copy the URL.
Now, let's execute the command in terminal
~/clickhouse local \
-q "select toHour(tpep_pickup_datetime) x__hour, count(*) y1__num_trips
from file('yellow_tripdata_2022-11.parquet')
group by x__hour order by x__hour FORMAT JSON" |
curl \
  --request POST 'https://pushboard.io/api/carddata/<card_id>/' \
  --header 'Content-Type: application/json' \
  --data-binary @-
Pushboard Syntax Explanation
In the first part of original command,
~/clickhouse local \
-q "select toHour(tpep_pickup_datetime) x__hour, count(*) y1__num_trips
from file('yellow_tripdata_2022-11.parquet')
group by x__hour order by x__hour FORMAT JSON"
You might have noticed that we create the query in a certain way, this is to make Pushboard understand the format of the query results:
- We add
x__andyN__prefixes to the name of the result fields to define how each field is used as - Output the data in JSON format so that it's accepted by the API endpoint
In the second part, we send the query results to Pushboard via a HTTP post request.
We use a pipe '|' to combine the two commands.
|
curl \
  --request POST 'https://pushboard.io/api/carddata/<card_id>/' \
  --header 'Content-Type: application/json' \
  --data-binary @-
As you continue to improve your query, simply replace the query in the first part and rerun the command, the dashboard will be refreshed automatically.
More about Pushboard
Pushboard has a couple of built-in graph styles. You can make a change by clicking on the ... of the card and select Style
If you'd like to learn more about Pushboard, please visit Pushboard docs (opens in a new tab)
References:
[1]Extracting, converting, and querying data in local files using clickhouse-local - https://clickhouse.com/blog/extracting-converting-querying-local-files-with-sql-clickhouse-local (opens in a new tab)
2023 © Pushboard